
Web Analytics Built for Clarity and Confident Decisions
Summary
Web analytics is not about dashboards or tracking everything that moves. It is about understanding user behavior well enough to make better business decisions with confidence. When implemented correctly, analytics reduces uncertainty and helps teams prioritize what actually matters. When implemented poorly, it creates noise, false certainty, and wasted effort.
This guide is written for founders and small-business owners who want practical clarity without jargon, and for marketing leads who need an analytics system they can operate and trust day to day. It explains how modern web analytics actually works, where most setups quietly fail, and how to build a measurement system that supports growth without unnecessary complexity.
FAQs
No. Analytics is most valuable when it helps you understand early behavior and validate assumptions before scale increases cost.
In most cases, no. Many businesses reach meaningful insight with a well-designed, event-based setup using free tools, like Google Analytics.
You will not be locked in to specific vendors or agencies for managing web analytics; however, changing from one platform to another will take planning and time. Best to run the new and old platforms simultaneously for at least 3 months.
What Web Analytics Actually Is
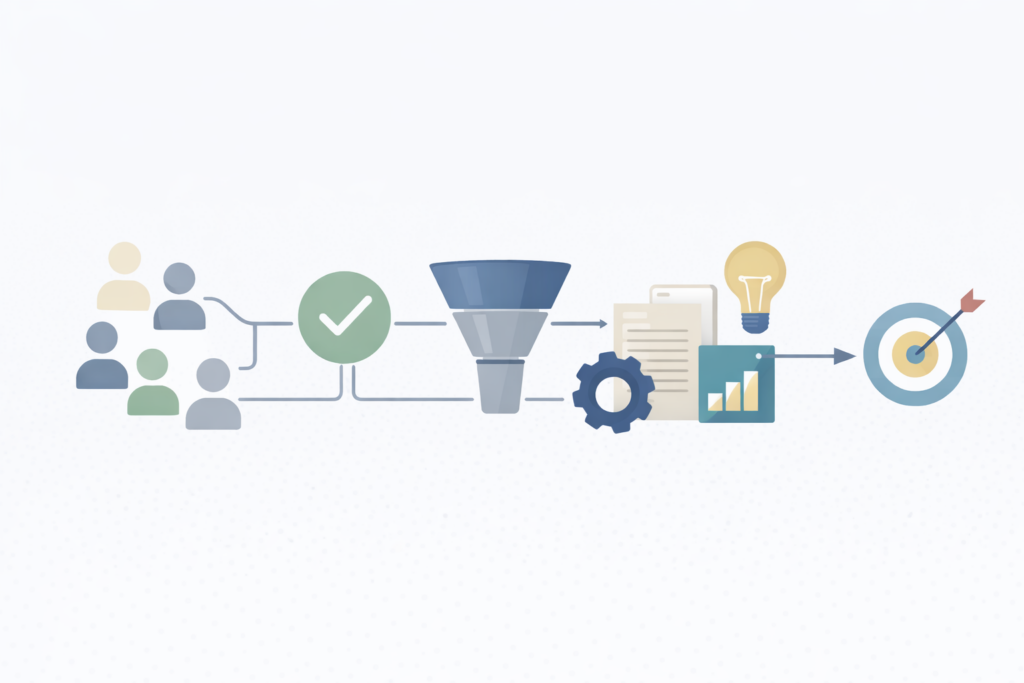
Web analytics is a system for measuring how people interact with your business across digital touchpoints, so decisions are based on evidence rather than assumptions. It connects behavior to outcomes. It answers questions such as where users hesitate, what actions lead to conversion, and which efforts actually contribute to results.
Most confusion around analytics exists because measurement is often treated as reporting. Numbers are collected because tools make it easy to collect them, not because they support a decision. Over time, this creates the illusion of insight without clarity. Teams feel informed but struggle to explain why results change or what to do next.
Analytics also fails quietly. When tracking is inconsistent or disconnected from business goals, nothing breaks visibly. Reports still load. Charts still move. The cost appears later as misallocated spend, stalled growth, and uncertainty during planning.
The purpose of this guide is to make the system visible. When you understand how analytics components fit together, you can make deliberate tradeoffs and avoid unnecessary complexity.
Resources:
Analytics as a System, Not a Tool
Analytics does not live inside a single platform. It is a system made up of measurement design, data collection, interpretation, and decision-making. Tools support this system, but they do not define it.
A common scenario is a business that installs analytics early and assumes the problem is solved. Over time, new tools are added for ads, email, heatmaps, and testing. Each promises better insight. In practice, data becomes fragmented. Metrics conflict. Confidence erodes.
The real tradeoff at this stage is simplicity versus perceived completeness. Adding more tools feels productive, but without a clear measurement model, it increases noise rather than understanding.
What teams underestimate is the long-term cost of incoherence. When no one can explain how metrics relate to outcomes, analytics becomes decorative. By contrast, a simple, well-documented system compounds value because it remains understandable as the business evolves.
AI can assist at this level by summarizing data and surfacing anomalies. It cannot decide what questions matter or how much complexity your business can support. That judgment remains human.
Resources:
- https://www.mckinsey.com/capabilities/growth-marketing-and-sales/our-insights/data-driven-decision-making
- https://www.gartner.com/en/articles/why-data-and-analytics-fail
Event-Based Measurement as the Foundation
Modern analytics works best when it focuses on events rather than pages. An event represents a meaningful action taken by a user, such as submitting a form, completing a purchase, or reaching a key step in a process.
Event-based measurement scales better because it reflects behavior, not structure. Pages change. Layouts evolve. Events remain tied to intent.
A typical abstract scenario is a service business that tracks page views and session counts but cannot explain why lead quality fluctuates. Without events tied to key actions, analytics cannot distinguish between curiosity and intent.
The tradeoff here is effort upfront versus clarity later. Designing events requires thought. Naming conventions and consistency matter. Many teams rush this step and pay for it later when data becomes hard to interpret.
What compounds over time is trust. When events are well defined and stable, teams rely on analytics to guide decisions instead of debating data quality.
AI can help validate event patterns and flag unexpected behavior. It also magnifies mistakes if events are poorly designed, because errors propagate faster.
Resources:
Measuring the Full Funnel End to End
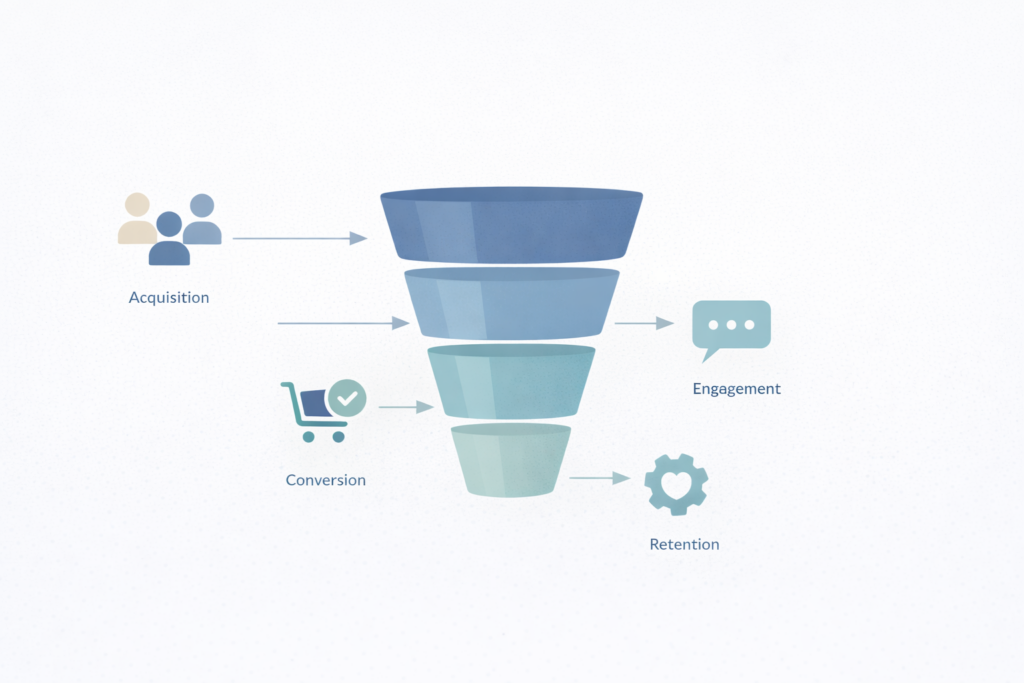
Analytics becomes useful when it reflects the full journey, not isolated touchpoints. A funnel connects acquisition, engagement, and conversion into a coherent view of how users move from first interaction to outcome.
This applies across business models. For ecommerce, it might include product discovery, checkout progression, and purchase completion. For B2B, it often includes landing page engagement, form submission, and follow-up actions.
A common situation is a business that evaluates channels independently. Ads look effective in one dashboard. Website engagement looks healthy in another. Conversions remain inconsistent. Without funnel visibility, teams optimize parts without understanding the whole.
The tradeoff is breadth versus focus. Tracking every possible step creates noise. Tracking too little hides friction. The discipline is choosing funnel steps that actually influence decisions.
What teams underestimate is how small improvements compound when friction is visible. Removing one unclear step can improve results without increasing traffic or spend.
AI supports this stage by identifying drop-offs and unusual shifts. Humans still define what success looks like and which tradeoffs are acceptable.
Resources:
From Observation to Insight
Raw data does not create insight. Interpretation does. Funnels show where users drop off. Paths show how they move. Time reveals patterns.
An abstract scenario is a business that notices declining conversions but cannot explain why. Looking at funnels reveals a specific step where users hesitate. Path analysis shows unexpected detours. Insight emerges from combining views, not from a single metric.
The tradeoff here is depth versus cognitive load. Deeper analysis provides more context but requires discipline to avoid overfitting explanations.
What compounds over time is learning velocity. Teams that regularly interpret analytics build intuition. Teams that only review reports during problems remain reactive.
AI can accelerate interpretation by highlighting correlations and summarizing trends. It cannot determine causality without human context.
Resources:
- https://hbr.org/2017/01/the-big-data-illusion
- https://www.dataversity.net/data-interpretation-vs-data-analysis/
Experimentation as a Learning Discipline
Analytics shows what is happening. Experimentation helps explain why. A structured approach to testing turns hypotheses into evidence.
This applies beyond marketing. Testing can improve onboarding flows, pricing pages, messaging, and user experience.
A common failure is testing without a hypothesis. Changes are made, results fluctuate, and no learning accumulates. Another is testing without reliable measurement, which produces false confidence.
The real tradeoff is speed versus learning quality. Fewer, better-designed tests outperform frequent but shallow experiments.
What compounds is institutional knowledge. Each test informs the next, reducing guesswork over time.
AI assists by generating variants and summarizing results. Judgment is required to define hypotheses and decide what outcomes matter.
Resources:
Behavioral Context and Heatmaps
Behavioral tools such as heatmaps and session recordings provide context that numbers alone cannot. They help explain why users hesitate or abandon flows.
Used responsibly, these tools complement analytics. Used without discipline, they create anecdotal bias.
A typical scenario is a team reacting strongly to a handful of session recordings while ignoring aggregate data. Visual evidence feels persuasive even when it is not representative.
The tradeoff is intuition versus evidence. Behavioral tools explain patterns but should not override quantitative signals.
What compounds is clarity when tools are used together. Analytics identifies the problem. Behavioral context explains it.
AI can summarize patterns across recordings. It cannot determine significance on its own.
Resources:
- https://www.nngroup.com/articles/heatmaps/
- https://www.nngroup.com/articles/qualitative-vs-quantitative-research/
Analytics Maturity Model for Small and Growing Businesses
This maturity model helps you understand where your current analytics setup sits and what it realistically supports. The goal is not to reach the highest level, but to operate confidently at the level your business actually needs.
Most small businesses operate between Levels 1 and 2. That is normal.
Level 1 — Basic Measurement
Analytics is installed and collecting data. Visibility exists, but decisions are rarely tied directly to measurement.
Level 2 — Event-Driven Visibility
Key actions are tracked intentionally. Funnels reflect real behavior. Analytics supports decisions.
Level 3 — Cross-Channel and Identity-Aware Analytics
Web behavior connects to email, advertising, and CRM data through consistent identifiers. Analysis shifts from sessions to people.
Level 4 — Continuous Optimization System
Measurement, testing, and iteration form a steady loop. This level is realistic for disciplined SMBs but requires restraint and ownership.
A practical rule is to advance only when you have questions you cannot currently answer.
Resources:

Measurement Integrity as a Quiet Risk
Analytics fails most often without warning. Inconsistent events, unclear definitions, and undocumented changes quietly undermine trust.
The business risk is not bad data, but confident wrong decisions. Maintaining integrity requires restraint, documentation, and clear ownership.
AI can monitor anomalies and flag inconsistencies. Accountability remains human.
Resources:
Privacy and Data Responsibility
Privacy is about collecting what you need, understanding why you need it, and being transparent. Over-collection increases risk without improving decisions.
A privacy-first approach simplifies analytics by forcing prioritization. Cleaner data is easier to trust and maintain.
AI can assist with documentation and policy drafting. Responsibility for data practices remains with the business.
Resources:
AI and Automation in Web Analytics
AI is increasingly embedded in analytics platforms. Used well, it reduces manual effort and surfaces patterns faster. Used carelessly, it creates overconfidence.
A responsible model is simple. Humans define goals and questions. AI assists with analysis and summarization. Humans interpret results and make decisions.
Analytics remains a human-led system supported by automation.
Resources:
The Digital Captain Co. Approach
Our approach emphasizes clarity, independence, and documentation. Clients retain ownership of data, accounts, and decisions.
We prioritize systems that teams can understand and evolve without ongoing dependency.
The Analytics Lifecycle
Analytics is not a one-time setup. Foundations enable visibility. Iteration improves clarity. Disciplined scaling prevents unnecessary complexity.
The most common long-term failure is adding tools without revisiting purpose.
Closing
The goal of web analytics is not optimization. It is confidence. When measurement is clear and intentional, decisions become easier. Growth becomes calmer. Analytics supports the business instead of distracting from it.
Get a free quote
Web Analytics Built for Clarity and Confident Decisions
Summary
Web analytics is not about dashboards or tracking everything that moves. It is about understanding user behavior well enough to make better business decisions with confidence. When implemented correctly, analytics reduces uncertainty and helps teams prioritize what actually matters. When implemented poorly, it creates noise, false certainty, and wasted effort.
This guide is written for founders and small-business owners who want practical clarity without jargon, and for marketing leads who need an analytics system they can operate and trust day to day. It explains how modern web analytics actually works, where most setups quietly fail, and how to build a measurement system that supports growth without unnecessary complexity.
FAQs
No. Analytics is most valuable when it helps you understand early behavior and validate assumptions before scale increases cost.
In most cases, no. Many businesses reach meaningful insight with a well-designed, event-based setup using free tools, like Google Analytics.
You will not be locked in to specific vendors or agencies for managing web analytics; however, changing from one platform to another will take planning and time. Best to run the new and old platforms simultaneously for at least 3 months.
What Web Analytics Actually Is
Web analytics is a system for measuring how people interact with your business across digital touchpoints, so decisions are based on evidence rather than assumptions. It connects behavior to outcomes. It answers questions such as where users hesitate, what actions lead to conversion, and which efforts actually contribute to results.
Most confusion around analytics exists because measurement is often treated as reporting. Numbers are collected because tools make it easy to collect them, not because they support a decision. Over time, this creates the illusion of insight without clarity. Teams feel informed but struggle to explain why results change or what to do next.
Analytics also fails quietly. When tracking is inconsistent or disconnected from business goals, nothing breaks visibly. Reports still load. Charts still move. The cost appears later as misallocated spend, stalled growth, and uncertainty during planning.
The purpose of this guide is to make the system visible. When you understand how analytics components fit together, you can make deliberate tradeoffs and avoid unnecessary complexity.
Resources:
Analytics as a System, Not a Tool
Analytics does not live inside a single platform. It is a system made up of measurement design, data collection, interpretation, and decision-making. Tools support this system, but they do not define it.
A common scenario is a business that installs analytics early and assumes the problem is solved. Over time, new tools are added for ads, email, heatmaps, and testing. Each promises better insight. In practice, data becomes fragmented. Metrics conflict. Confidence erodes.
The real tradeoff at this stage is simplicity versus perceived completeness. Adding more tools feels productive, but without a clear measurement model, it increases noise rather than understanding.
What teams underestimate is the long-term cost of incoherence. When no one can explain how metrics relate to outcomes, analytics becomes decorative. By contrast, a simple, well-documented system compounds value because it remains understandable as the business evolves.
AI can assist at this level by summarizing data and surfacing anomalies. It cannot decide what questions matter or how much complexity your business can support. That judgment remains human.
Resources:
- https://www.mckinsey.com/capabilities/growth-marketing-and-sales/our-insights/data-driven-decision-making
- https://www.gartner.com/en/articles/why-data-and-analytics-fail
Get a free quote
Event-Based Measurement as the Foundation
Modern analytics works best when it focuses on events rather than pages. An event represents a meaningful action taken by a user, such as submitting a form, completing a purchase, or reaching a key step in a process.
Event-based measurement scales better because it reflects behavior, not structure. Pages change. Layouts evolve. Events remain tied to intent.
A typical abstract scenario is a service business that tracks page views and session counts but cannot explain why lead quality fluctuates. Without events tied to key actions, analytics cannot distinguish between curiosity and intent.
The tradeoff here is effort upfront versus clarity later. Designing events requires thought. Naming conventions and consistency matter. Many teams rush this step and pay for it later when data becomes hard to interpret.
What compounds over time is trust. When events are well defined and stable, teams rely on analytics to guide decisions instead of debating data quality.
AI can help validate event patterns and flag unexpected behavior. It also magnifies mistakes if events are poorly designed, because errors propagate faster.
Resources:
Measuring the Full Funnel End to End
Analytics becomes useful when it reflects the full journey, not isolated touchpoints. A funnel connects acquisition, engagement, and conversion into a coherent view of how users move from first interaction to outcome.
This applies across business models. For ecommerce, it might include product discovery, checkout progression, and purchase completion. For B2B, it often includes landing page engagement, form submission, and follow-up actions.
A common situation is a business that evaluates channels independently. Ads look effective in one dashboard. Website engagement looks healthy in another. Conversions remain inconsistent. Without funnel visibility, teams optimize parts without understanding the whole.
The tradeoff is breadth versus focus. Tracking every possible step creates noise. Tracking too little hides friction. The discipline is choosing funnel steps that actually influence decisions.
What teams underestimate is how small improvements compound when friction is visible. Removing one unclear step can improve results without increasing traffic or spend.
AI supports this stage by identifying drop-offs and unusual shifts. Humans still define what success looks like and which tradeoffs are acceptable.
Resources:
From Observation to Insight
Raw data does not create insight. Interpretation does. Funnels show where users drop off. Paths show how they move. Time reveals patterns.
An abstract scenario is a business that notices declining conversions but cannot explain why. Looking at funnels reveals a specific step where users hesitate. Path analysis shows unexpected detours. Insight emerges from combining views, not from a single metric.
The tradeoff here is depth versus cognitive load. Deeper analysis provides more context but requires discipline to avoid overfitting explanations.
What compounds over time is learning velocity. Teams that regularly interpret analytics build intuition. Teams that only review reports during problems remain reactive.
AI can accelerate interpretation by highlighting correlations and summarizing trends. It cannot determine causality without human context.
Resources:
- https://hbr.org/2017/01/the-big-data-illusion
- https://www.dataversity.net/data-interpretation-vs-data-analysis/
Experimentation as a Learning Discipline
Analytics shows what is happening. Experimentation helps explain why. A structured approach to testing turns hypotheses into evidence.
This applies beyond marketing. Testing can improve onboarding flows, pricing pages, messaging, and user experience.
A common failure is testing without a hypothesis. Changes are made, results fluctuate, and no learning accumulates. Another is testing without reliable measurement, which produces false confidence.
The real tradeoff is speed versus learning quality. Fewer, better-designed tests outperform frequent but shallow experiments.
What compounds is institutional knowledge. Each test informs the next, reducing guesswork over time.
AI assists by generating variants and summarizing results. Judgment is required to define hypotheses and decide what outcomes matter.
Resources:
Behavioral Context and Heatmaps
Behavioral tools such as heatmaps and session recordings provide context that numbers alone cannot. They help explain why users hesitate or abandon flows.
Used responsibly, these tools complement analytics. Used without discipline, they create anecdotal bias.
A typical scenario is a team reacting strongly to a handful of session recordings while ignoring aggregate data. Visual evidence feels persuasive even when it is not representative.
The tradeoff is intuition versus evidence. Behavioral tools explain patterns but should not override quantitative signals.
What compounds is clarity when tools are used together. Analytics identifies the problem. Behavioral context explains it.
AI can summarize patterns across recordings. It cannot determine significance on its own.
Resources:
- https://www.nngroup.com/articles/heatmaps/
- https://www.nngroup.com/articles/qualitative-vs-quantitative-research/
Analytics Maturity Model for Small and Growing Businesses
This maturity model helps you understand where your current analytics setup sits and what it realistically supports. The goal is not to reach the highest level, but to operate confidently at the level your business actually needs.
Most small businesses operate between Levels 1 and 2. That is normal.
Level 1 — Basic Measurement
Analytics is installed and collecting data. Visibility exists, but decisions are rarely tied directly to measurement.
Level 2 — Event-Driven Visibility
Key actions are tracked intentionally. Funnels reflect real behavior. Analytics supports decisions.
Level 3 — Cross-Channel and Identity-Aware Analytics
Web behavior connects to email, advertising, and CRM data through consistent identifiers. Analysis shifts from sessions to people.
Level 4 — Continuous Optimization System
Measurement, testing, and iteration form a steady loop. This level is realistic for disciplined SMBs but requires restraint and ownership.
A practical rule is to advance only when you have questions you cannot currently answer.
Resources:
Measurement Integrity as a Quiet Risk
Analytics fails most often without warning. Inconsistent events, unclear definitions, and undocumented changes quietly undermine trust.
The business risk is not bad data, but confident wrong decisions. Maintaining integrity requires restraint, documentation, and clear ownership.
AI can monitor anomalies and flag inconsistencies. Accountability remains human.
Resources:
Privacy and Data Responsibility
Privacy is about collecting what you need, understanding why you need it, and being transparent. Over-collection increases risk without improving decisions.
A privacy-first approach simplifies analytics by forcing prioritization. Cleaner data is easier to trust and maintain.
AI can assist with documentation and policy drafting. Responsibility for data practices remains with the business.
Resources:
AI and Automation in Web Analytics
AI is increasingly embedded in analytics platforms. Used well, it reduces manual effort and surfaces patterns faster. Used carelessly, it creates overconfidence.
A responsible model is simple. Humans define goals and questions. AI assists with analysis and summarization. Humans interpret results and make decisions.
Analytics remains a human-led system supported by automation.
Resources:
The Digital Captain Co. Approach
Our approach emphasizes clarity, independence, and documentation. Clients retain ownership of data, accounts, and decisions.
We prioritize systems that teams can understand and evolve without ongoing dependency.
The Analytics Lifecycle
Analytics is not a one-time setup. Foundations enable visibility. Iteration improves clarity. Disciplined scaling prevents unnecessary complexity.
The most common long-term failure is adding tools without revisiting purpose.
Closing
The goal of web analytics is not optimization. It is confidence. When measurement is clear and intentional, decisions become easier. Growth becomes calmer. Analytics supports the business instead of distracting from it.